Fran Metrics
Blog
For Franchisors
& Franchisees
Don’t Dump the P&L. Fix It.
Back in 2021 we published a post called “Get a Score Card, Dump the P&L!” We meant it. Franchise P&Ls had a reputation, and most of it was earned: they showed up late, every franchisee’s books looked different, and the bottom line said more about tax strategy than performance.
Here’s the thing, though. Franchisors don’t actually want to dump the P&L. They want one that works. So we spent the last couple of years building that, and we’d like to formally retract our advice. Don’t dump the P&L. Fix it.
Problem 1: Every location’s books look different
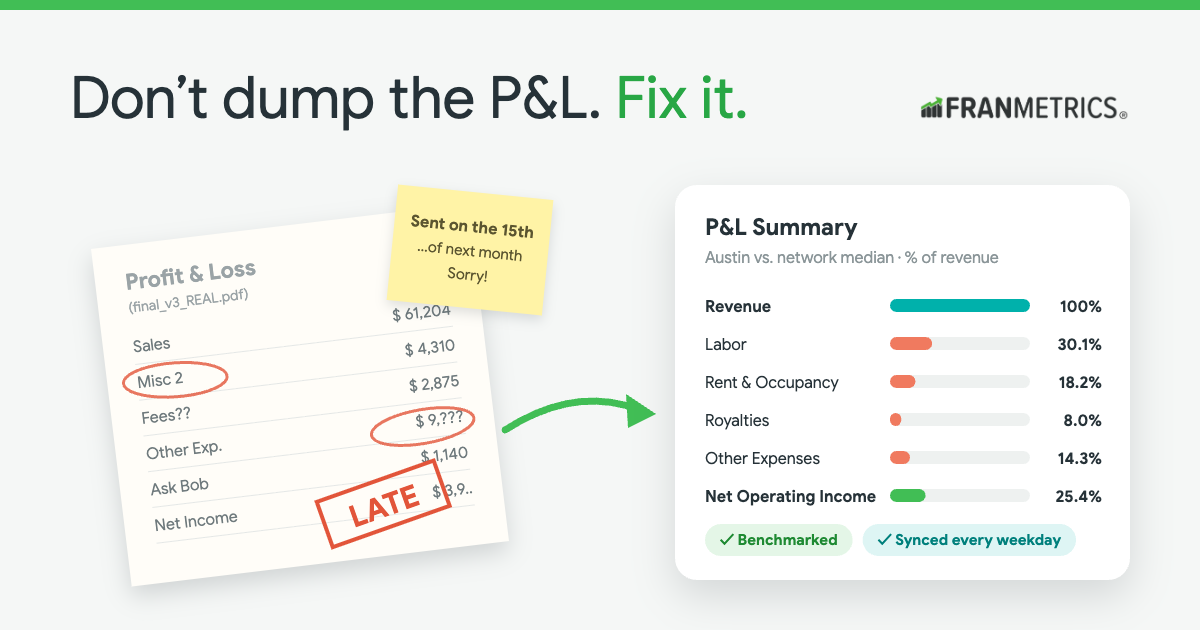
One franchisee books royalties under “Fees.” Another puts them in “Other Expenses.” A third has an account called “Misc 2.” Comparing those P&Ls side by side is like comparing recipes written in three languages.
The fix: Fran Metrics maps every franchisee’s chart of accounts into one standard chart of accounts for your system. Their books stay exactly how their bookkeeper likes them. You get one P&L where every location’s lines mean the same thing, so location vs. location is finally apples to apples.
Problem 2: It’s 45 days old by the time you see it
If you’re waiting for franchisees to email a PDF on the 15th, you’re managing last month’s problems next month.
The fix: QuickBooks Online syncs every weekday, and the QuickBooks, Xero, Google Sheets, and CSV connections are free. No setup fee, no monthly fee. The numbers show up on their own, and nobody has to chase anybody.
Problem 3: The bottom line can mislead
A big repair, a one-time bonus, a vehicle lease that runs through the business. Look only at net income and you’ll draw the wrong conclusion about a perfectly healthy location.
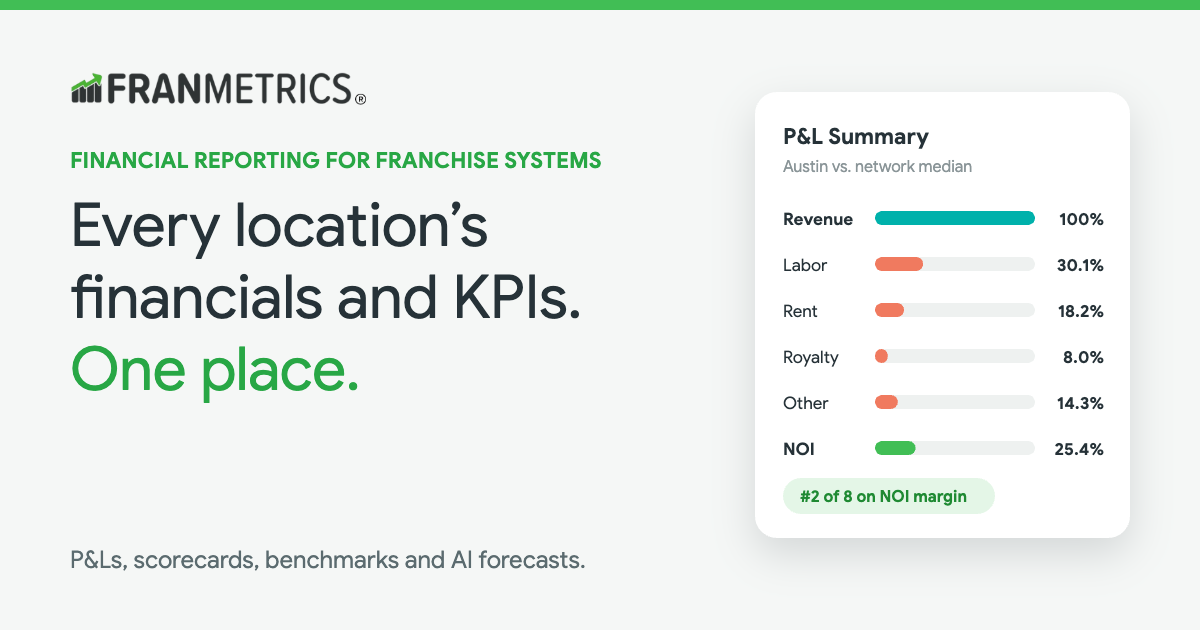
The fix: Every line is shown as a % of revenue and benchmarked against your network median. A one-time repair or a cost that’s quietly creeping up jumps right out, and you can drill into any number, right down to the transactions behind it. The comparative P&L sits next to the balance sheet and budget vs. actual for every location, and franchisees can enter their own budgets.
Problem 4: It doesn’t tell you why
Sales were down. Okay, why? A P&L on its own can’t answer that. It was the part of our 2021 post we still agree with most.
The fix: Your financials live right next to your KPI scorecards: new customers, reviews, labor, retention, whatever drives your concept. The P&L tells you what happened. The scorecard tells you why. You need both, in the same place.
Bonus: a P&L for next quarter, too
Fran AI groups your locations into demographic cohorts: look-alike trade areas by household income, age, and more. Then it forecasts each location’s P&L line by line, based on how its cohort performed at the same stage. It even works for a site that hasn’t opened yet, which makes it handy for development conversations and Item 19 planning. Fran AI is included with every subscription.
So, scorecard or P&L?
Both. That was always the real answer, we just didn’t have a P&L worth keeping yet. Now every location’s financials and KPIs live in one place, on your laptop or your phone.
We take our numbers seriously, but not ourselves. If you’d like to see your own system’s numbers this way, book a demo and we’ll show you.