-
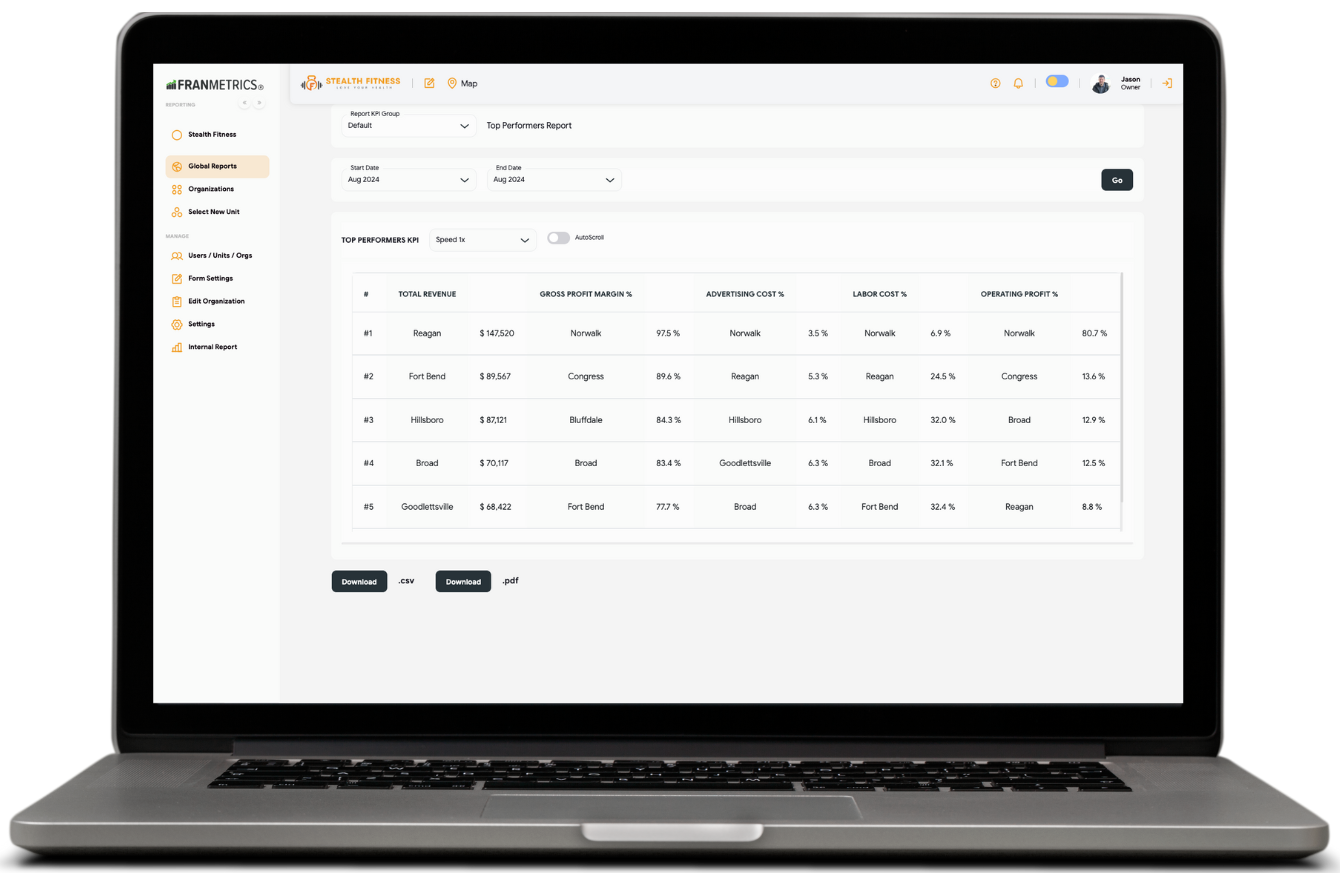
Data for Item 19
Quickly get data for Item 19 of your FDD!
-
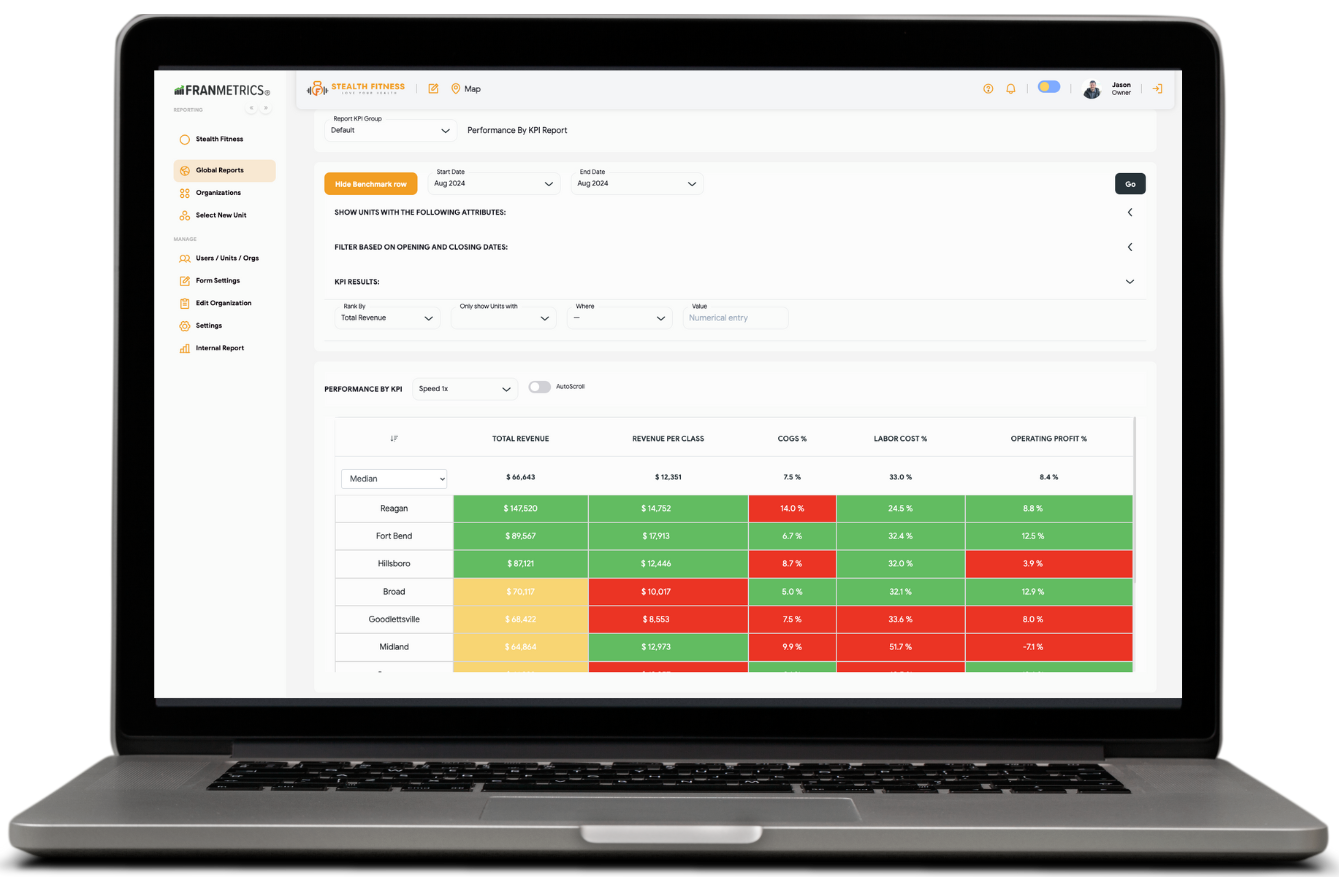
Unit Level Economics
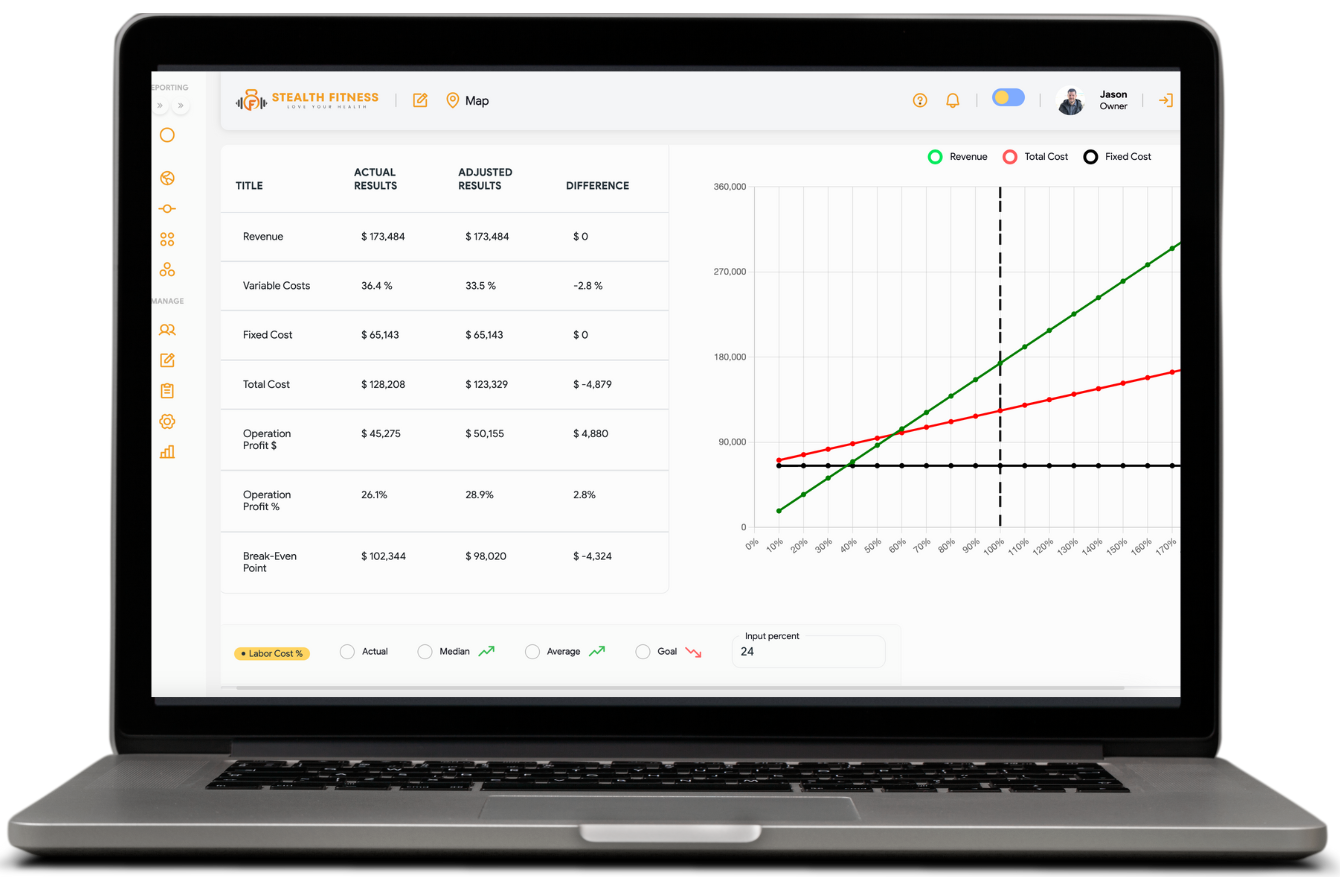
Instantly see which units are thriving and which are struggling under a variety of metrics
-
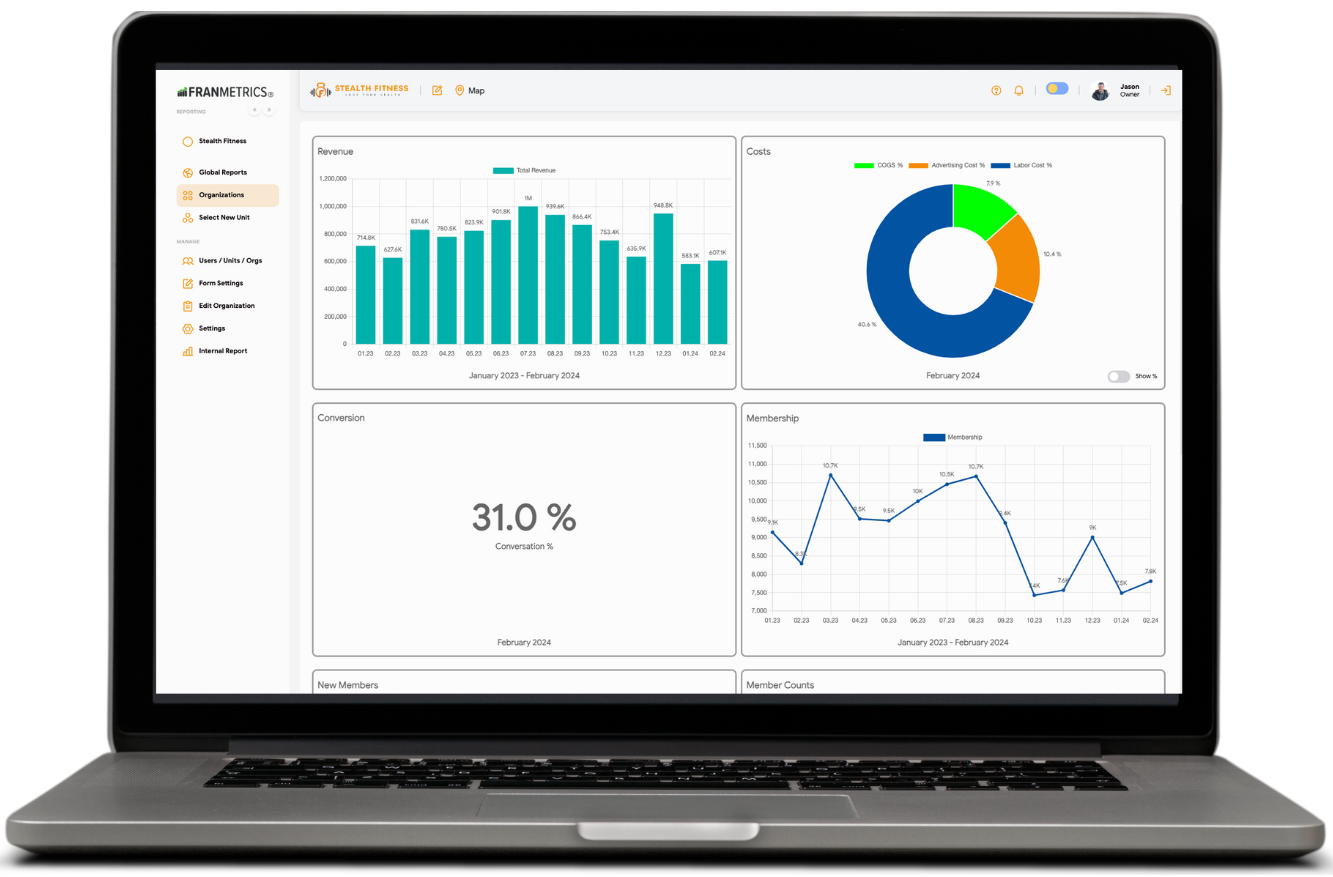
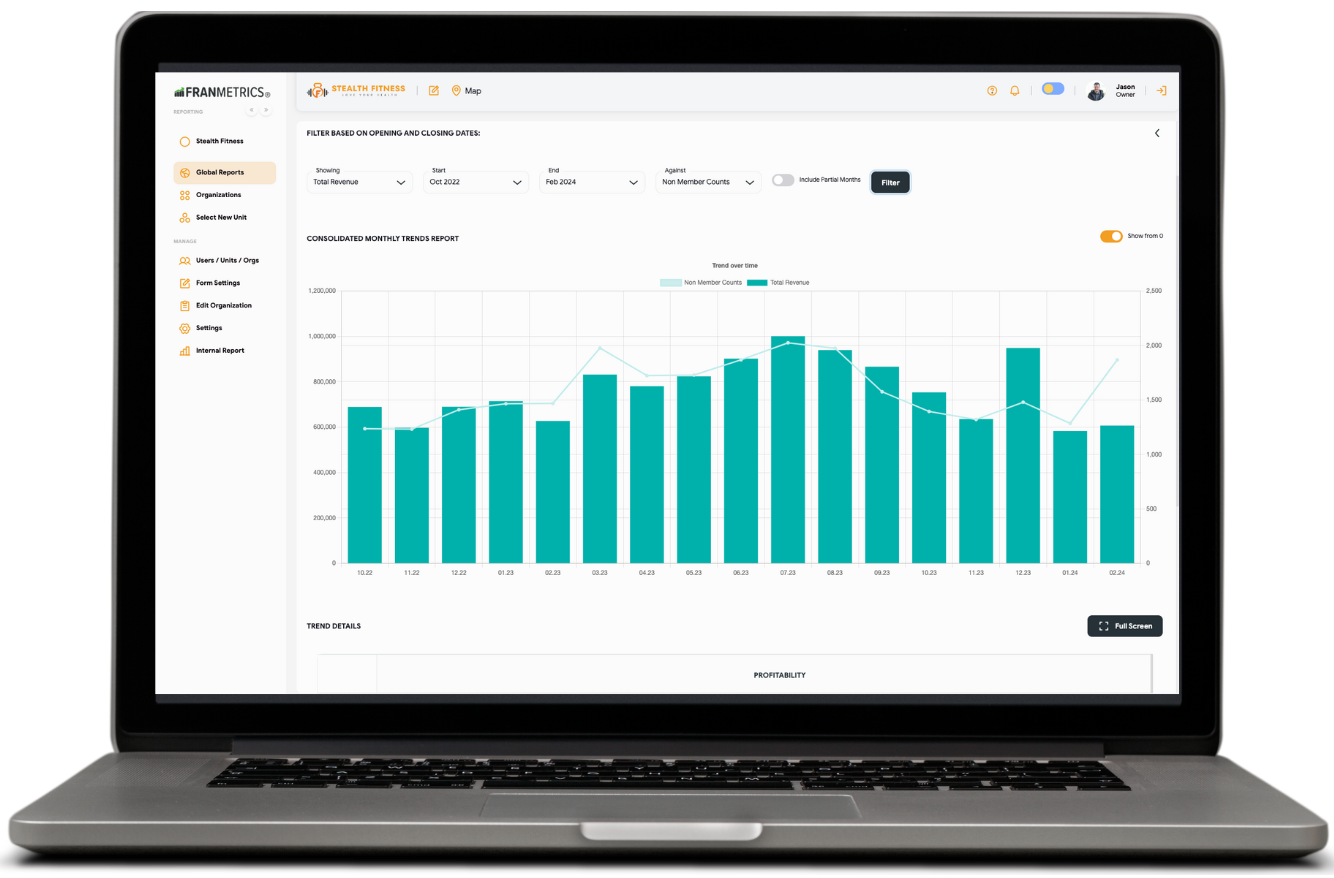
KPI Tracking
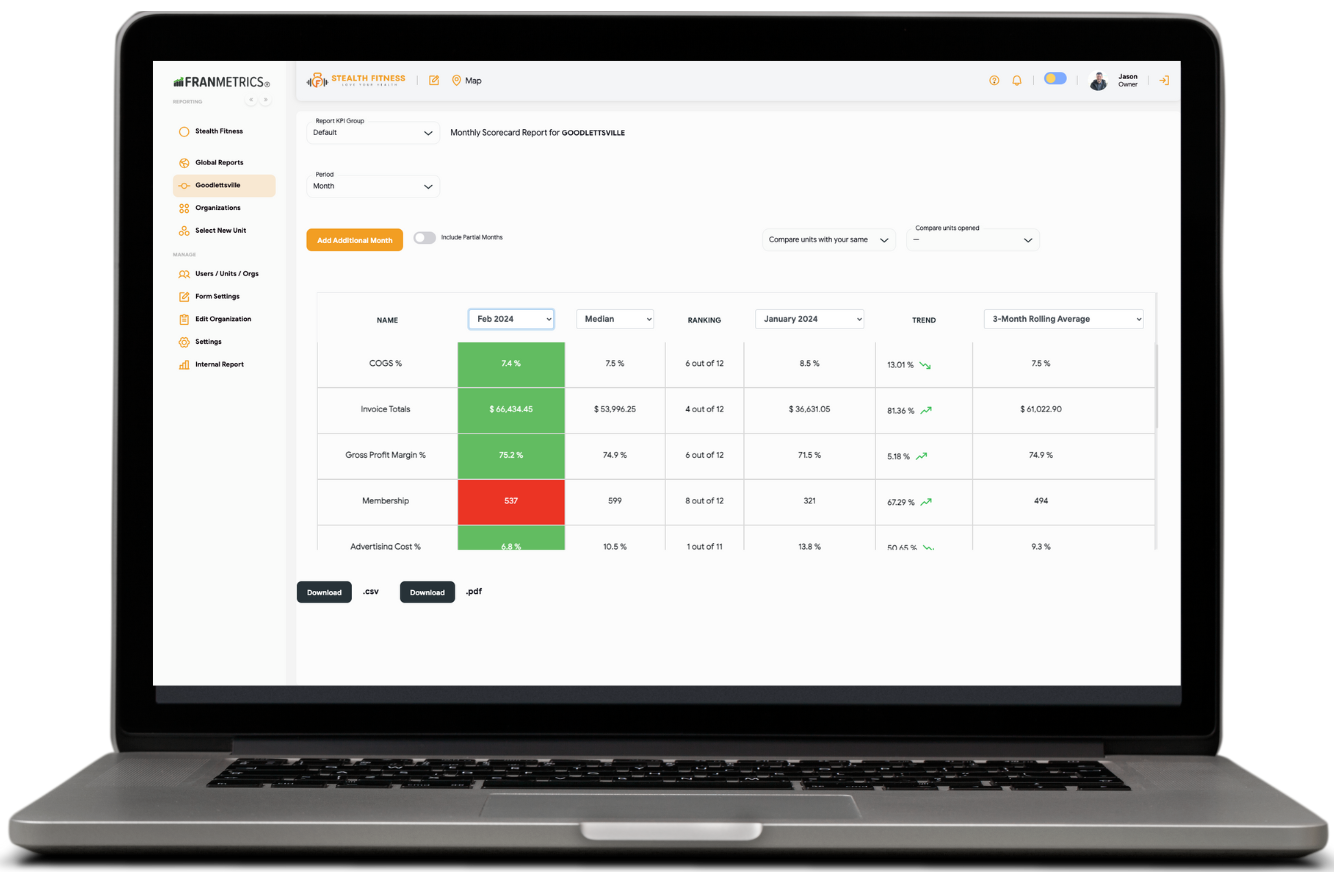
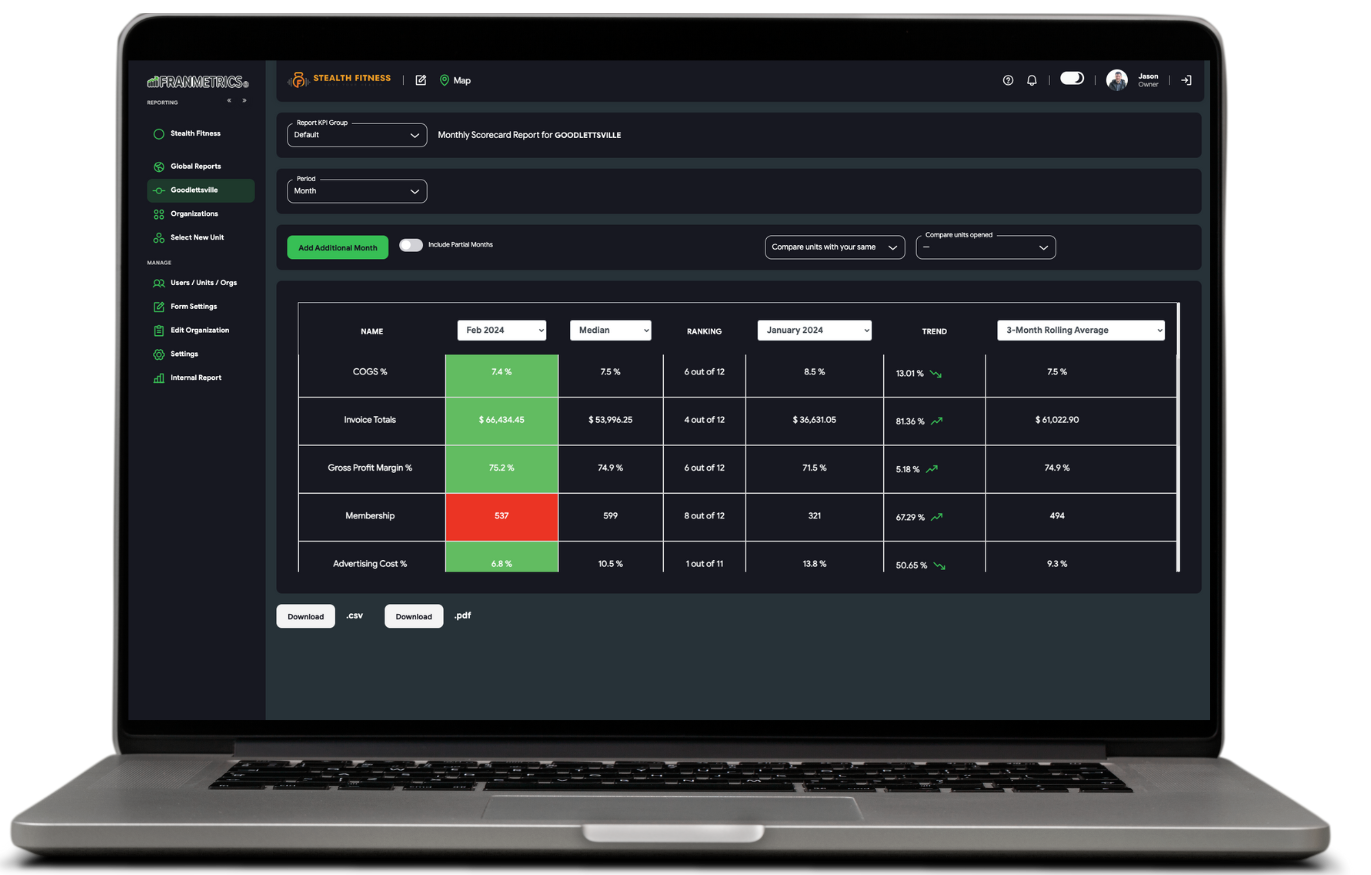
See monthly or weekly KPI Scorecards consolidated or by unit. See how KPI's trend through time and how they may correlate.
-
Evaluation (Field Audits)
The easiest in the industry to set up and use with over 400 predefined questions
-
Engagement
Keep your team and franchisees in the loop with custom notifications based on your performance goals.
-
Full service bookkeeping
If each franchisee has their own bookkeeper, you may not be comparing apples to apples when reviewing your reports. Hire us to do the books and make sure all of your reporting is consistent!
Better Disclosures
Get more detailed earning claims in your FDD
Franchise Group Comparisons
See which types of franchisees out perform others
Turn data into power
Help your franchisees make data-driven decisions
Many of the figures are not actionable
There is no differentiating between vital and non-vital data. Does anyone really need to know they paid the same rent last month as they paid the month before and they will pay again next month? Probably not.
It has lagging indicators, not leading indicators
Sales were down last month! It took you until the 15th to look at your P&L, and now the issue is as much as 45 days old! Could you be tracking specific numbers sooner and look at other figures that may have been causing lower sales, such as customer service scores?
It can be misleading
Most businesses have every incentive to make that bottom line as LOW as possible for tax purposes. Also, franchisees may have major repairs or other one-time expenses showing a result not related to their actual performance. Most people looking at a P&L go right to the bottom line and make an instant judgment without having the time to do a full investigation. Sure, the franchisee probably knows why, but the franchisor is most likely not going to have the conversation to figure out the issue.
It is missing other crucial data that you need to track
If you are taking the time to look at unit level performance, shouldn't you be looking at all the relevant data all in one place?


Lorem Ipsum Title
Lorem ipsum is placeholder text commonly used in the graphic.
The software helps us aggregate, organize and visualize data in a way we haven’t been able to do before with other tools. It’s designed for all levels of users that want actionable data & intelligence. There is no need for a data engineer to use or implement this tool effectively. Highly recommend for franchises with multiple locations.
Fran Metrics has been a game-changer for our franchise business. The platform’s robust analytics and customizable tools have empowered us to optimize our operations, identify growth opportunities, and streamline our franchise financial literacy for improved paths to profitability. With Fran Metrics, we have gained deeper insights into our franchise network’s performance, enabling us to make data-driven decisions that drive success. It’s an essential tool for any franchisor looking to elevate their operations and maximize franchisee satisfaction!
We have been on board with Fran Metrics for a while now, and it has been phenomenal working with Jason and his team. It has been a game-changer for us, to be honest. In the past, we had to go into the back end of our P OS system and pull data at an enterprise level or location level, which was time-consuming, and now we get to spend more time actually analyzing the data because Fran Metrics s is pulling it over for us automatically. There have been things that we have been able to identify different trends in different areas that we need to address just by looking at the data the way that Fran Metrics is reporting it. So, we highly recommend Fran Metrics. And Jason especially.
Fran Metrics has been a game changer for us. The onboarding process was incredibly smooth, and Jason provided support every step of the way. What really sets them apart is their ability to create customized reporting dashboards that align with our business KPIs. The dashboards are intuitive, easy to navigate, and give us clear, actionable insights. If you’re looking for a partner who truly understands franchise operations and delivers excellent customer service, Fran Metrics is the way to go.
Subscribe
In most cases we will reply within minutes,
if requested
Get in
Touch


