
Your numbers, finally working for you.
Fran Metrics turns the financials you already report into clear, accurate, easy-to-read insight, so you can make smarter decisions, protect your profit, and catch small problems before they get expensive.
From raw financials to action, automatically
Every franchisor asks for your financials. Fran Metrics puts them to work for you in three steps.
Collection
We collect your P&L and balance sheet securely and automatically, so you stop chasing spreadsheets and emailing reports. Fran Metrics reads your data; it never pushes anything into your QuickBooks.
Quality Assurance
We filter out data known to be inaccurate and cut the noise, so what lands on your dashboard is clean, consistent, and actually worth acting on.
Reporting
Visualize, interact with, and export the numbers that matter, and see exactly how your location compares to the rest of the system.
What you get as a franchisee
Everything in one place, built specifically for franchise locations like yours.
Automatic submissions
Your required financial reporting happens on its own. No more manual uploads or month-end scrambles.
Clean data, not noise
Inaccurate figures get flagged and filtered, so you trust what you see and spend your time deciding, not double-checking.
Your own dashboard
Interactive charts (pie, bar, line, stacked) you can shape yourself. Add or remove the KPIs you actually care about.
See how you stack up
Benchmark your location against all or similar locations, see the rankings, and watch the top performers. A little friendly competition never hurt.
Break-even & "what if?"
Swap your labor or payroll cost for the median of similar locations and instantly see the opportunity. Compare your operating profit at different revenue levels.
Unit-level scorecard
Every KPI against your goals and the system median or average, with month-over-month and year-over-year trends. Download to a spreadsheet anytime.
All locations in one place
Own more than one unit? Consolidate everything and compare your locations side by side without juggling logins.
Chat with your data
Ask questions in plain English and get answers from your own numbers, with AI insights built for franchise systems.
Anywhere, on any device
Your dashboard is mobile-friendly, so your numbers are with you on the floor, on the road, or on the couch.
See it in action
A quick look at the screens you'll actually use.
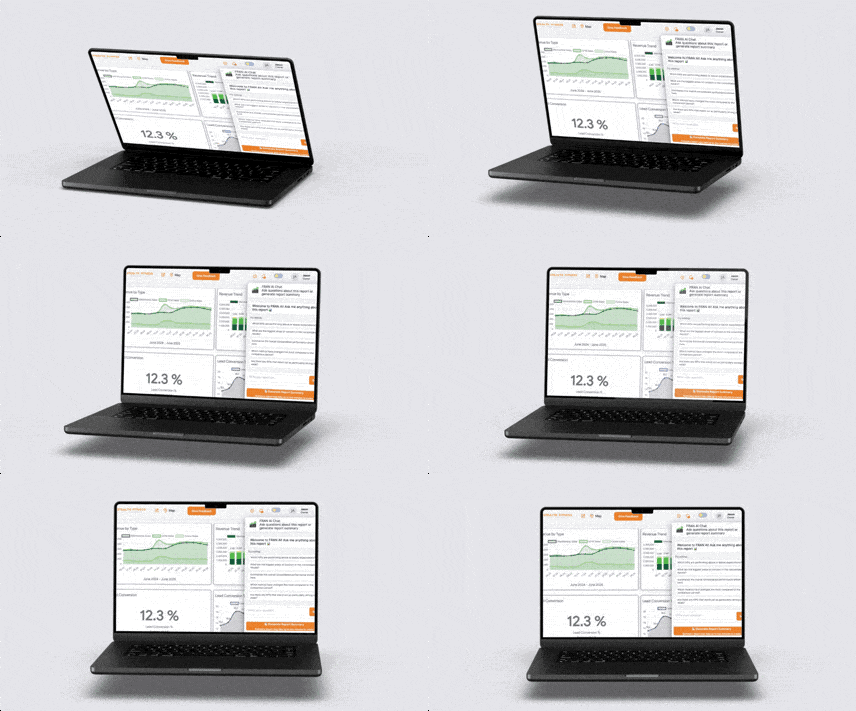
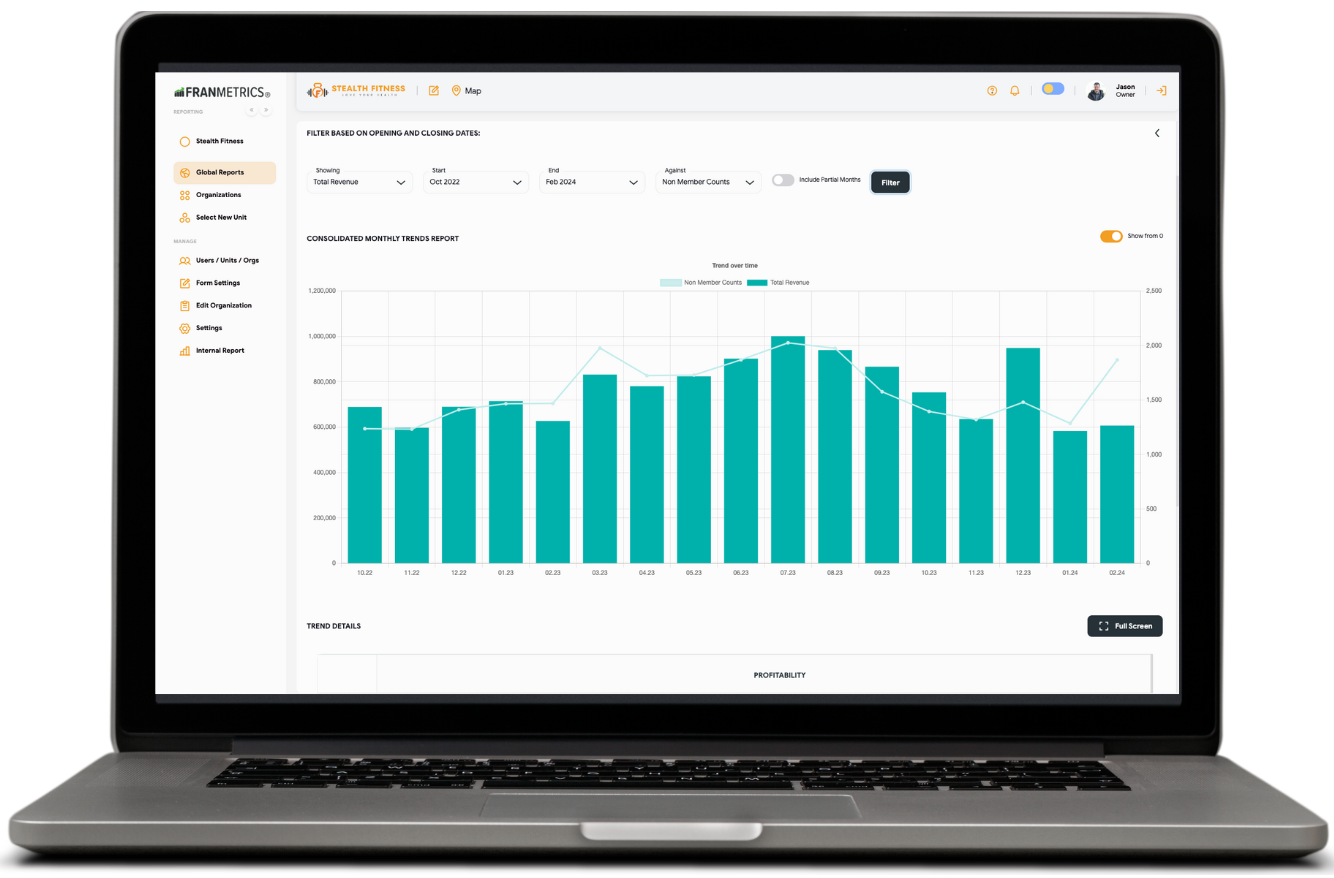
Your real-time dashboard
Live data in customizable widgets, pie, bar, line and stacked charts, and you add or remove the KPIs you care about.
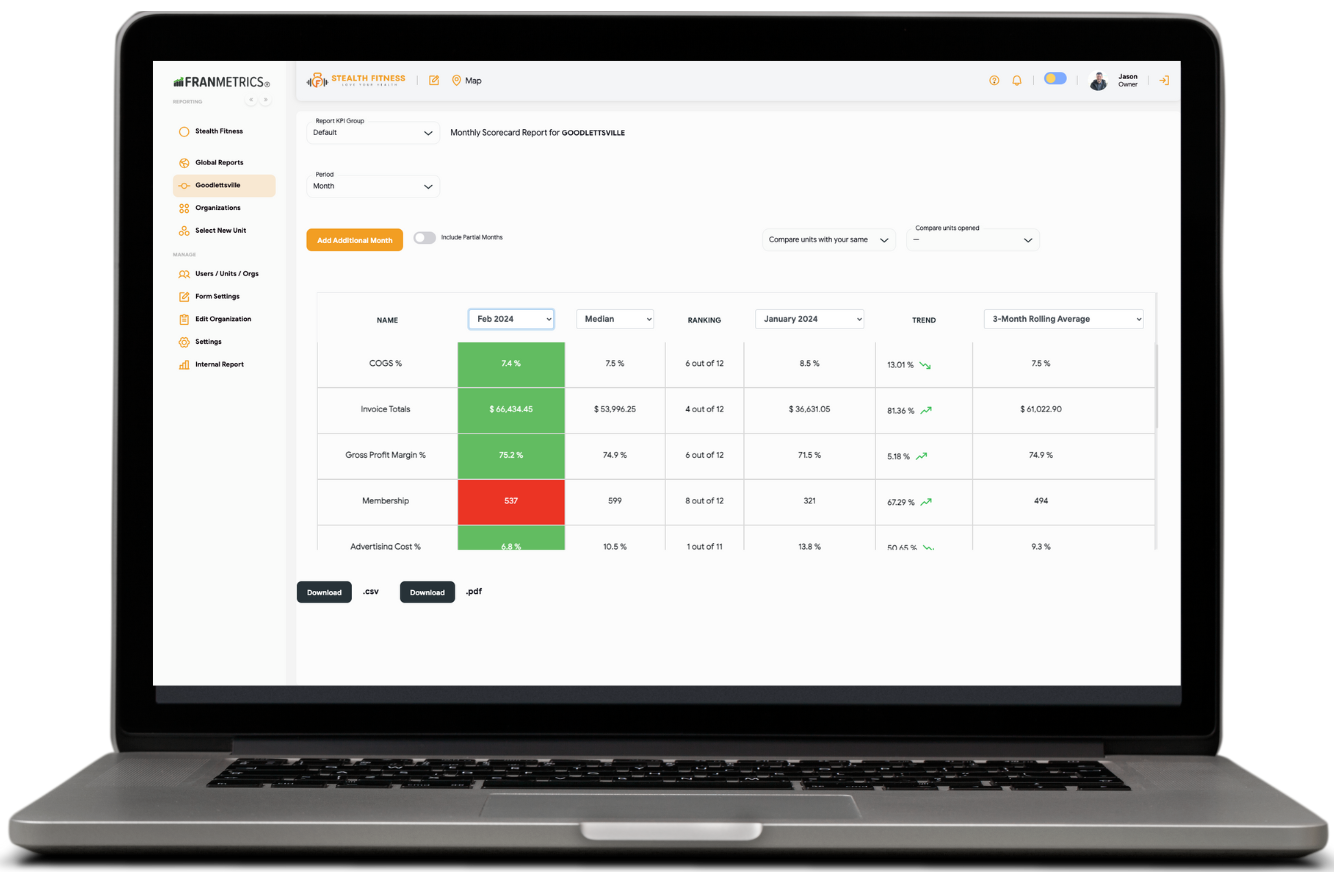
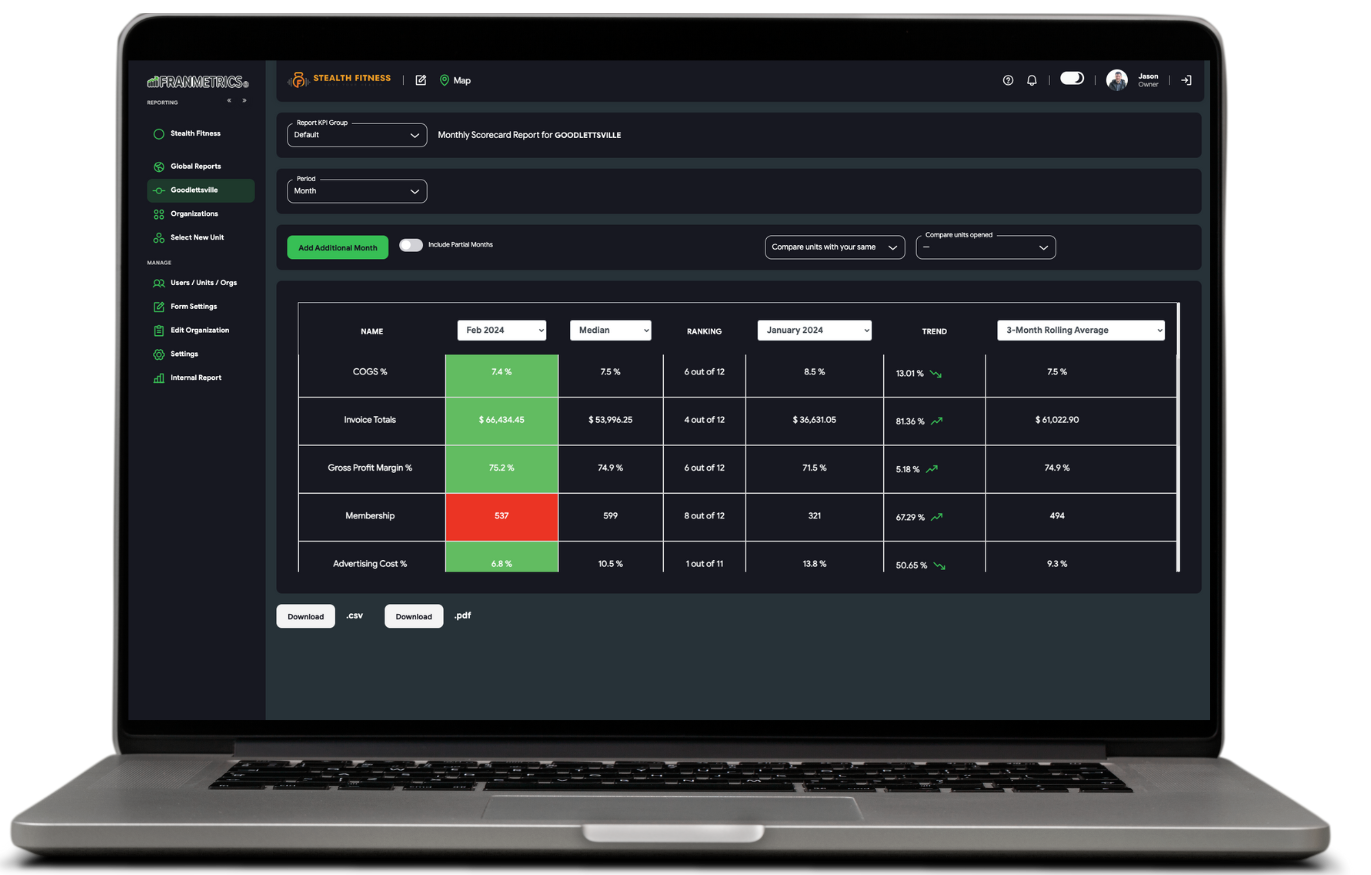
Your scorecard at a glance
Every KPI against your goals and the system median or average, with month-over-month and year-over-year trends. Download to a spreadsheet anytime.
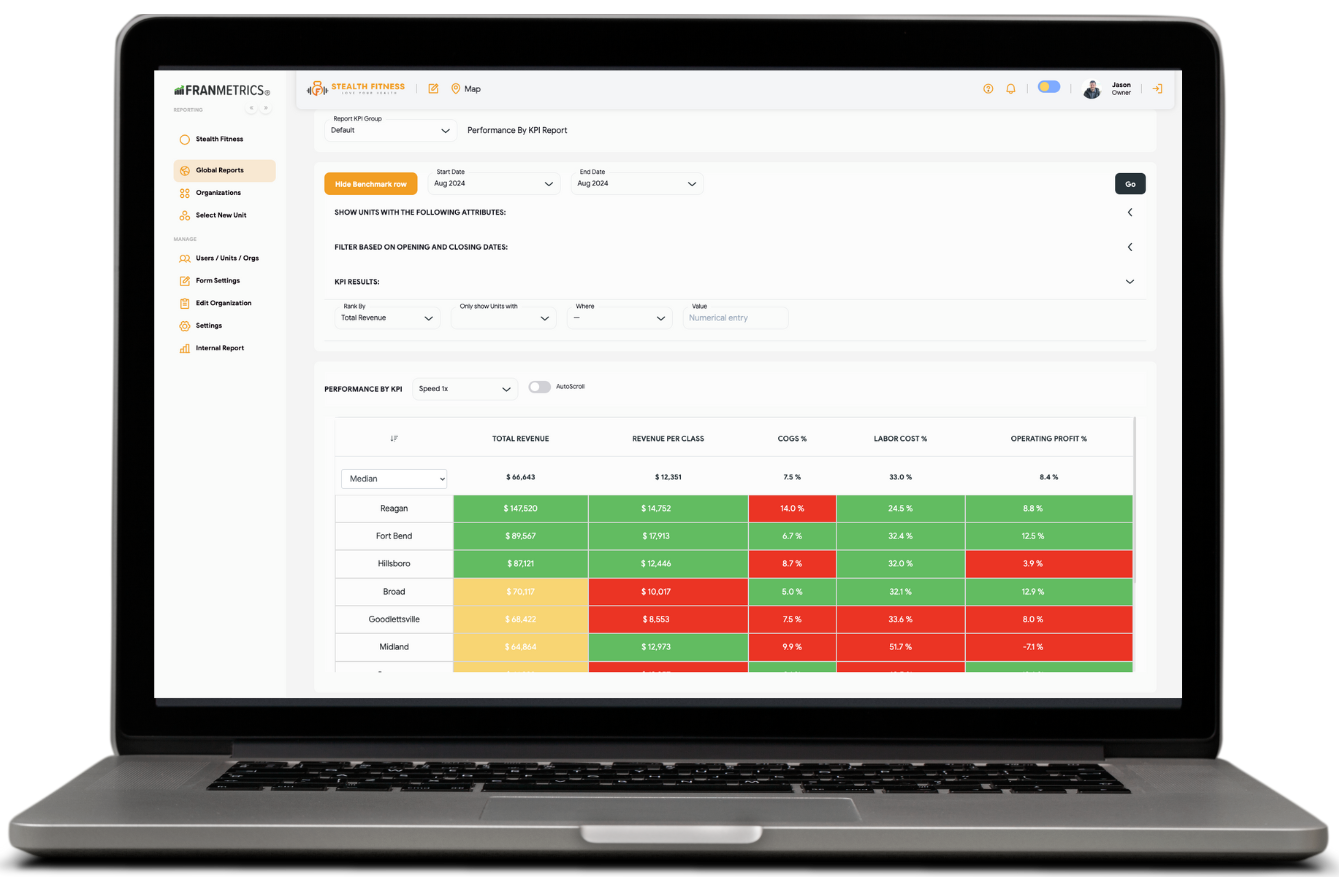
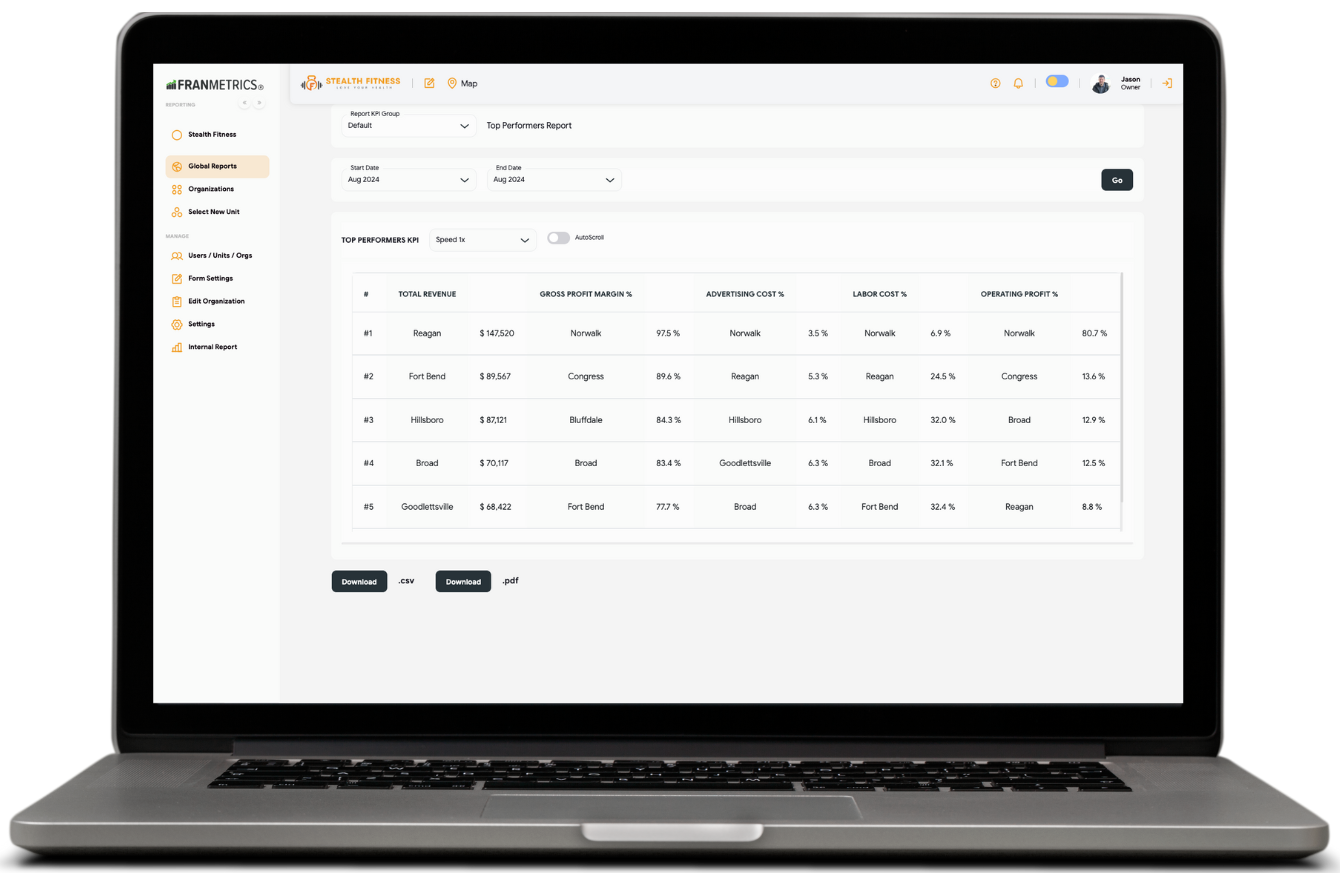
See how you rank
Rank, filter and compare locations in one report. Filter by top or bottom percentile, location type, or locations open a full year, and add a benchmark row to spot what drives results.
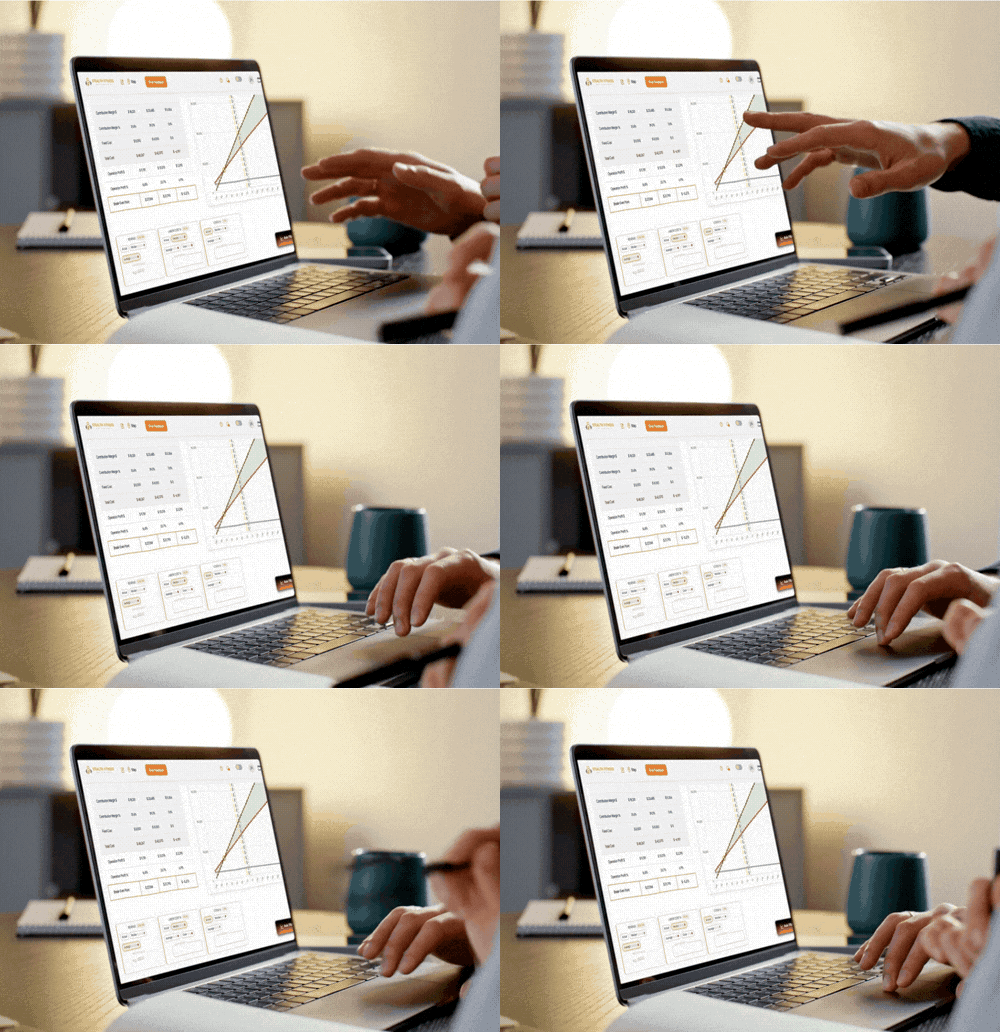
Break-even & "what if?"
Swap your labor or payroll for the median of similar locations and instantly see the opportunity, then compare operating profit at different revenue levels.
Franchise systems that get it
Operators and franchisors already turning their numbers into action.
"What really sets them apart is their ability to create dashboards that align with our business KPIs. They're intuitive, easy to navigate, and give us clear, actionable insights."
Jackie Smith · Pizza Factory
"Having financial and operational data in one place makes it so much easier to see trends and have productive conversations. It helps franchisees engage with their numbers in a way that feels manageable and useful, not overwhelming."
Melissa Herold · Wise Coatings
Ready to make your numbers work for you?
Log in to your dashboard, or stop by the Help Center for guides, answers, and a hand getting set up.
We take our numbers seriously. Ourselves? Not so much.