
Features Integrations About Us Blog Pricing
Log In
© FRANMETRICS, 2019 — 2026

Fran Metrics
Blog

For Franchisors
& Franchisees
December, 2024
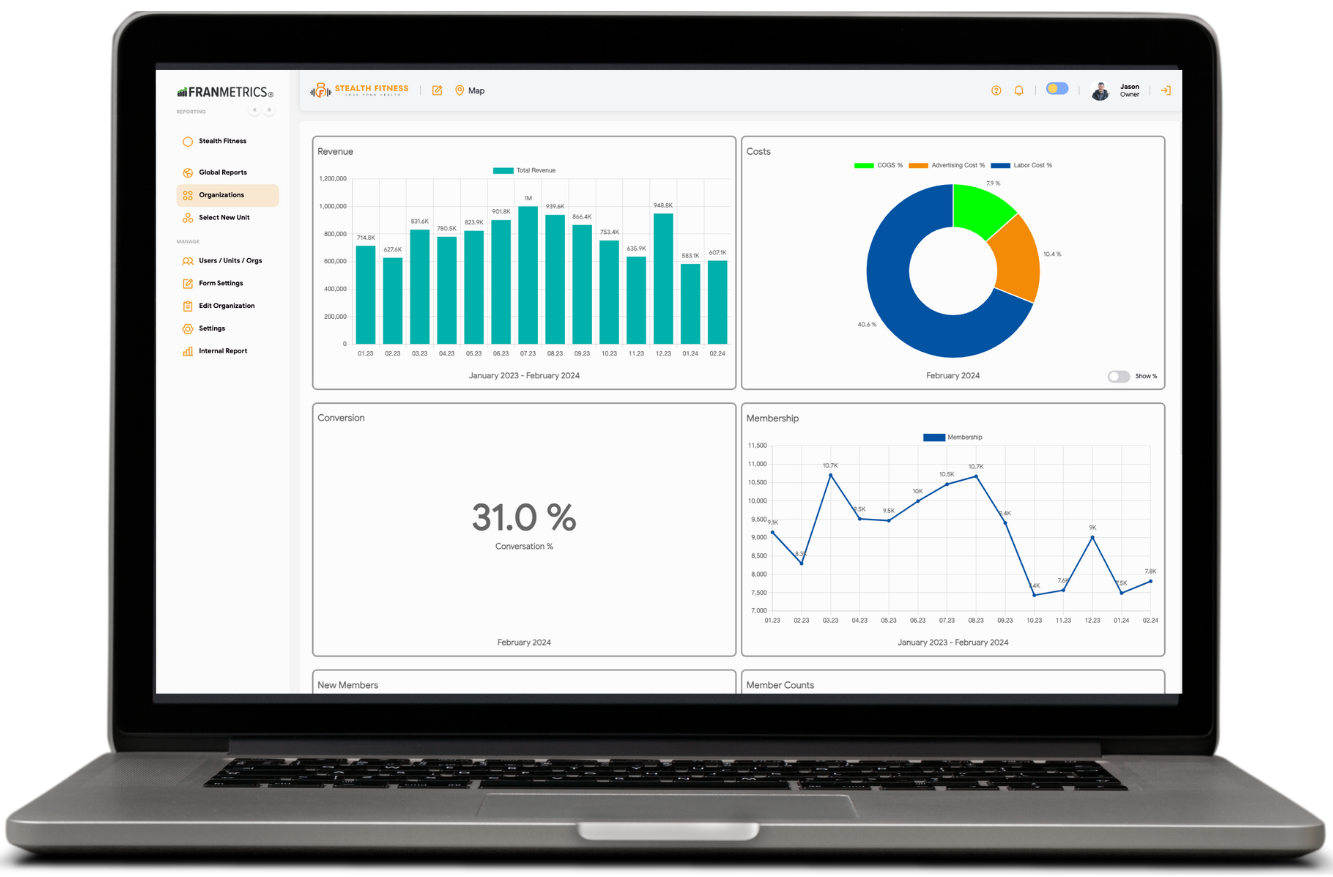
𝐄𝐱𝐜𝐢𝐭𝐢𝐧𝐠 𝐍𝐞𝐰𝐬: 𝐈𝐧𝐭𝐫𝐨𝐝𝐮𝐜𝐢𝐧𝐠 Fran Metrics 𝐃𝐚𝐬𝐡𝐛𝐨𝐚𝐫𝐝𝐬! 
December, 2024
Designing a Solution for Franchisee Marketing Support and Engagement
December, 2023
Franchise Data Problems Are Really Culture Problems
October, 2022
Happy Fall from Fran Metrics: Software Update
July, 2022
Turning "What If" into Actionable Data

June, 2022
Choosing the Right KPIs: Part 2 of 2
May, 2022
Choosing the Right KPIs- Part 1 of 2
May, 2022
Scorecards: Actionable Data to Inform Ongoing Business Decisions with Confidence
April, 2022
Empower your Franchisee: Track Employee Satisfaction & Retention
March, 2022
The KPIs Your Franchise Can’t Afford to Overlook
January, 2022
The Importance of Making Time to…
January, 2022
Stop Avoiding Your Field Evaluations
January, 2022
Google Reviews - New KPI Integration
August, 2021
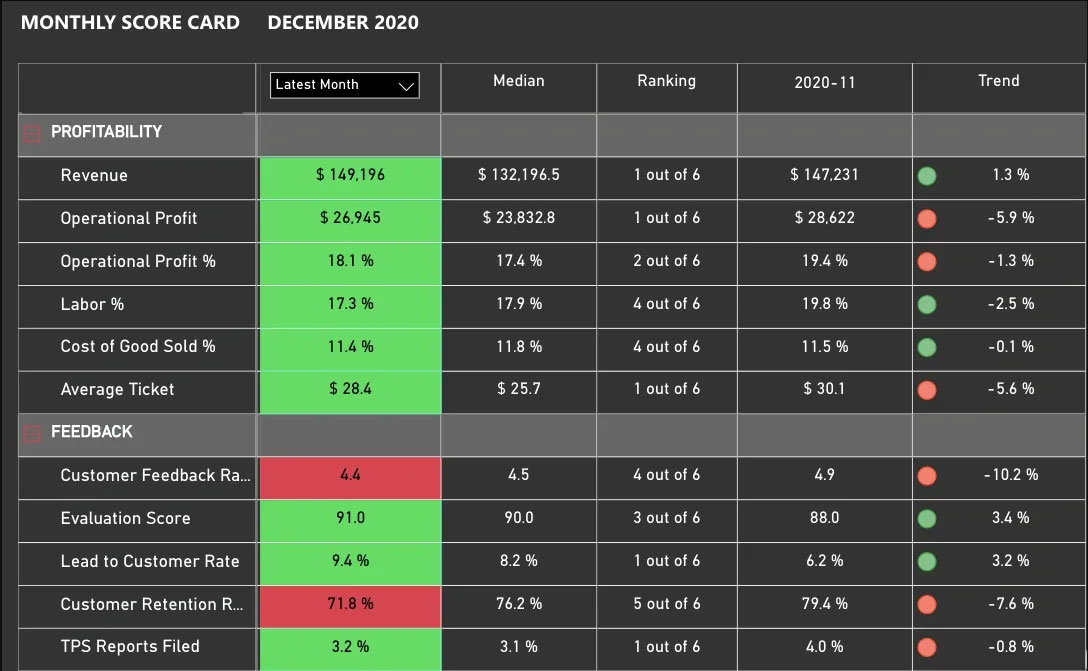
Get a Score Card, Dump the P&L!
August, 2021
Update Your FDD for the cloud!
Previous
1 2
Next

Subscribe

E-mail
  • jason@franmetrics.net
Documents
  • LinkedIn
  • Terms of Use
  • Privacy policy
  • Support page
© FRANMETRICS, 2019 — 2026Devcube
Increase profits. Maximize transparency.

Don't dump the P&L. Fix it.

Franchise P&Ls have a reputation: late, inconsistent, and impossible to compare. We took that personally. Fran Metrics turns every location's books into financials you can actually run a franchise system on.

Every location's books look different

✓One P&L that lines up

A standard chart of accounts maps every franchisee's books into the same P&L, so location vs. location is finally apples to apples.

It's 45 days old by the time you see it

✓Fresh books, every weekday

QuickBooks syncs every weekday. QuickBooks and Xero connections are free, so nobody's emailing spreadsheets on the 15th.

The bottom line can mislead

✓Benchmarked line by line

Every line is measured as a % of revenue against the network median, so a one-time repair or a creeping cost jumps right out.

It doesn't tell you why

✓Financials meet KPIs

P&L, balance sheet, and budget vs. actual sit right next to your KPI scorecards. See what happened and why, in one place.

Fran AI

Forecast the P&L before it happens

Fran AI groups your locations into demographic cohorts: look-alike trade areas by household income, age, and more. It then forecasts each location's P&L line by line from how its cohort performed at the same stage. It even works for a site that hasn't opened yet. Included with every subscription.

See your financials in Fran Metrics All features →
Blue Peak Fitness — Austin
Sample data. Blue Peak Fitness and all figures are fictional.
Mobile Dashboards

Every KPI, readable on your phone

Fran Metrics dashboards aren't just mobile-friendly. Every chart opens into a fullscreen view built for reading real numbers on a real phone.

  • 1
    Touch the exact figuresTap any chart to zoom, drag across it for month-by-month values, pinch into a date range, or flip it into the table behind it.
  • 2
    See where every location ranksSwitch to any location and its numbers line up against the network average and median.
  • 3
    Financials, not just KPIsA P&L summary for any location or the whole network, from revenue down to net operating income, with margins benchmarked across locations.
  • 4
    Goals and AI Insights, built inScorecards flag what's on track, and AI Insights call out trends, anomalies, and who could use a coaching call.
👆 This demo is live. Pick a location, flip to Weekly, or tap the ⤢ on any chart.
Book a demo See pricing →

This demo is a simplified illustration, not an exact representation of the Fran Metrics platform. Features, screens, and layout in the product may differ. Blue Peak Fitness and all figures are fictional.

9:41
See it with your numbers